Table of Contents
- Data Pipeline Architecture
- Prerequisite
- Making the Environment Ready
- Kafka Producer
- Create the Logstash Pipeline
- Access data in Kibana
The current world is heavily dependent on data. Everyone is generating large amounts of data.
It is becoming a challenge to read large amounts of data and then process it and finally perform some action over that data. In this post, we will be creating a data pipeline using Kafka, Elasticsearch, Logstash, and Kibana which will serve three responsibilities
- Read data from the Kafka topic
- Process it using Logstash
- Dump the data to elastic search and then visualize the data using Kibana
Data Pipeline Architecture
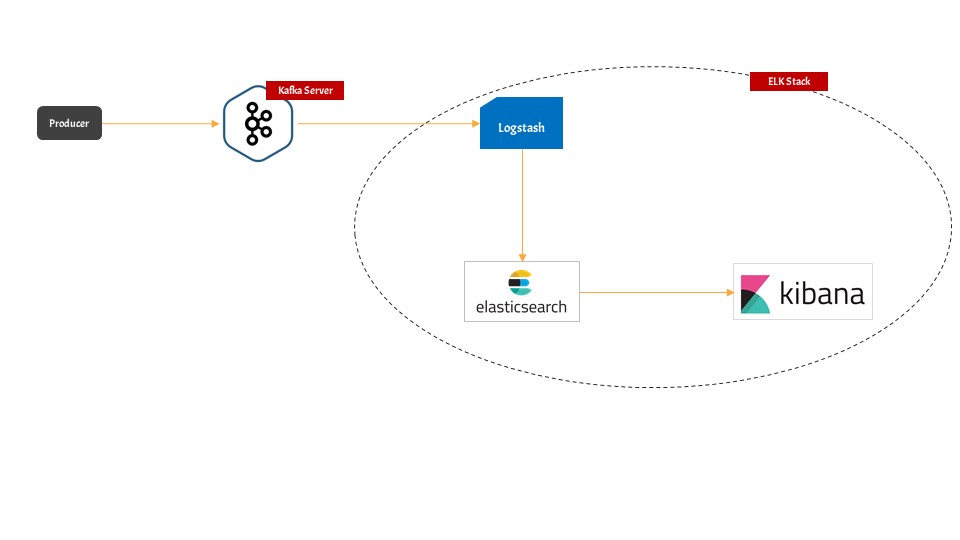
There are five important components in this pipeline
- Kafka Server: This is the point where data is published first.
- Producer: The producer plays the role of publishing data to Kafka topic. In the real world, you can have any entity that produces data to Kafka topic. In our example, we will be generating fake user registration data.
- Elasticsearch: This will act as a database that will store the user registration data in itself. But the main question that arises is which entity will push data to Elasticsearch.
- Logstash: Logstash will play the role of middleman where we will read data from the Kafka topic and then it will insert that data into Elasticsearch.
- Kibana: Kibana will play the role of a Graphical User Interface which will present the data in a readable or graphical format
Prerequisite
- we will be using Ubuntu 18.04 to create this data pipeline, but you can use your own development environment also. Install Ubuntu Desktop 18.04
- Python3.x must be installed
- Docker must be installed Install Docker on Ubuntu 18.04
- Docker Compose must be installed Install Docker Compose on Ubuntu 18.04
Making the Environment Ready
Kafka & Zookeeper & Kafka Manager
- As we need Kafka where the Publisher can publish the registered user data, so we need to install Kafka.
- We will be installing Kafka using docker-compose. Install Kafka-Zookeeper-KafkaManager Using Docker Composer
- Once you start the services present in the docker-compose file then the most important points are
- Kafka is listening on PORT 9093
- Zookeeper is listening on PORT 2181
- Kafka Manager is listening on PORT 9000
Elasticsearch && Kibana
- we will be installing Elasticsearch and Kibana using docker-compose. Install Elasticsearch and Kibana using Docker Compose
- After the installation, Elasticsearch will be running at PORT 9092
- After the installation, Kibana will be running at PORT 5601
Logstash
- We are using Ubuntu 18.04, so you can set up Logstash using this post. Install Logstash on Ubuntu 18.04
- The configuration folder for Logstash will be located at
cd /etc/logstash/conf.d/Kafka Producer
What we will be doing with Kafka Producer
- We will be creating a Kafka producer that will produce registered user data and publish that to the Kafka topic
- We will be using the Python Faker module to generate fake registered user data
Install the dependencies of Kafka Producer
pip install Fakerpip install kafka-pythonWriting the Producer Producer in Python
The final producer will be something like this
from faker import Faker
from kafka import KafkaProducer
import json
from data import get_registered_user
import time

fake = Faker()

def get_registered_user():
return {
"name": fake.name(),
"address": fake.address(),
"created_at": fake.year()
}

def json_serializer(data):
return json.dumps(data).encode("utf-8")

producer = KafkaProducer(bootstrap_servers=['192.168.0.10:9093'],
value_serializer=json_serializer)

if __name__ == "__main__":
while 1 == 1:
registered_user = get_registered_user()
print(registered_user)
producer.send("registered_user", registered_user)
time.sleep(4)- The data is being pushed to the registered_user topic
- Kafka broker is running at 9093 port
Learn the details about this producer in this post
Create the Logstash Pipeline
- we will read data from the Kafka topic registered_user
- Then we will push the data to the Elasticsearch index named registered_user
- Navigate to the configuration folder of logstash
cd /etc/logstash/conf.d/create a new file
touch kafka-elastic-pipeline.confput the below contents in the conf file
input {
kafka {
bootstrap_servers => "192.168.0.10:9093"
topics => ["registered_user"]
}
}

output {
elasticsearch {
hosts => ["192.168.0.10:9200"]
index => "registered_user"
workers => 1
}
}- The pipeline will create an input section that will try to read the data from the Kafka broker
- The Kafka server address is given by the bootstrap_servers config
- we will be reading the data from registered_user topic
input {
kafka {
bootstrap_servers => "192.168.0.10:9093"
topics => ["registered_user"]
}
}- The pipeline will create an output section that will push data to the elastic search server
- Elasticsearch is running at 192.16.0.10:9200
- we are pushing the data to registered_user index of the elastic search
Save the file and your pipeline will be active
You can check Logstash logs at /var/log/logstash folder
Access data in Kibana
- Open Kibana running at http://192.168.0.10:5601
- Goto Management Menu
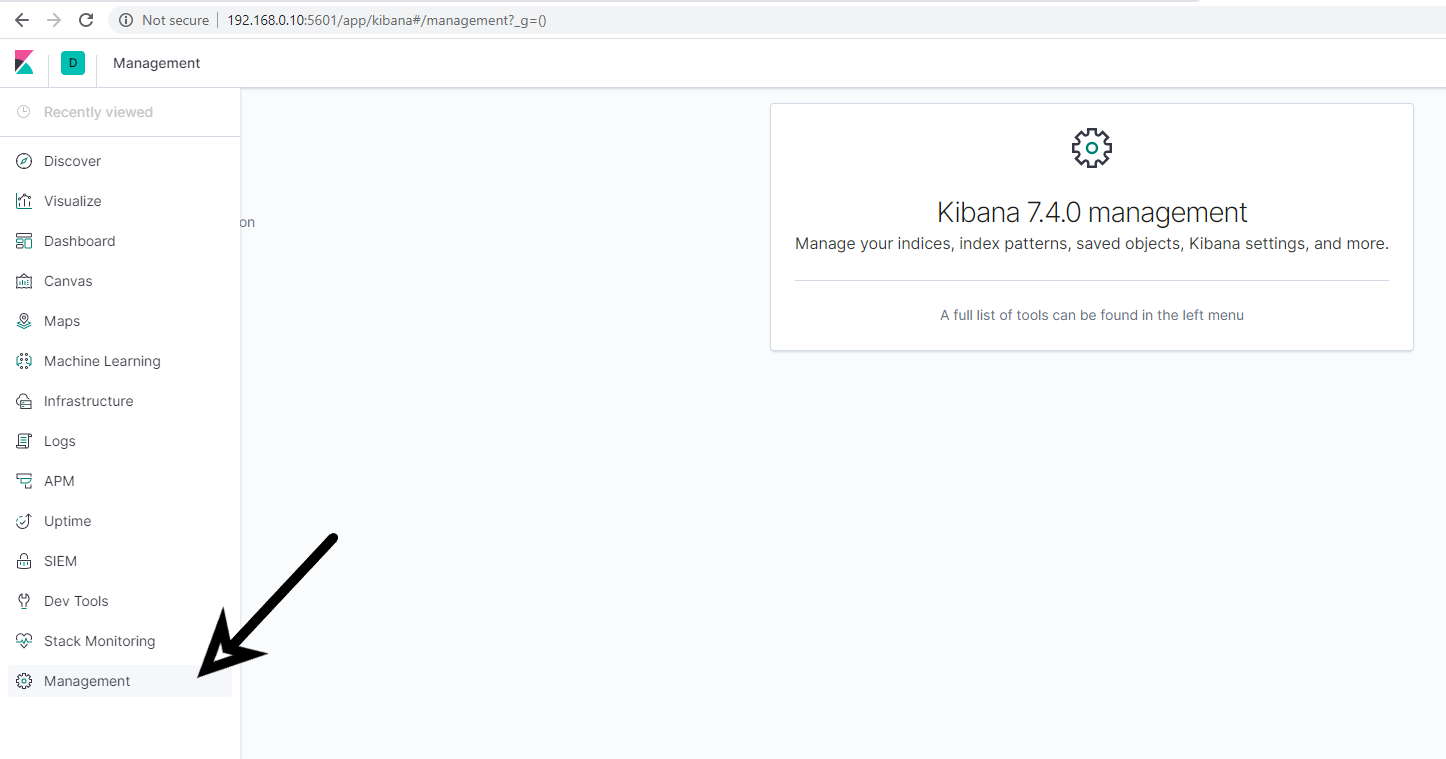
- Goto Index Management and search for the registered_user index
- Then create the index
- Finally Goto the Discover section
- you can see the registered user logs