- Prerequisite
- Create a Docker compose file
- Add MySQL Service to the Docker Compose File
- Add Prometheus Service to Docker Compose File
- Add Grafana to Docker Compose File
- Add MySQL Exporter service to Docker Compose
- Add Prometheus Configuration File
- Final Docker Compose file for MySQL Prometheus
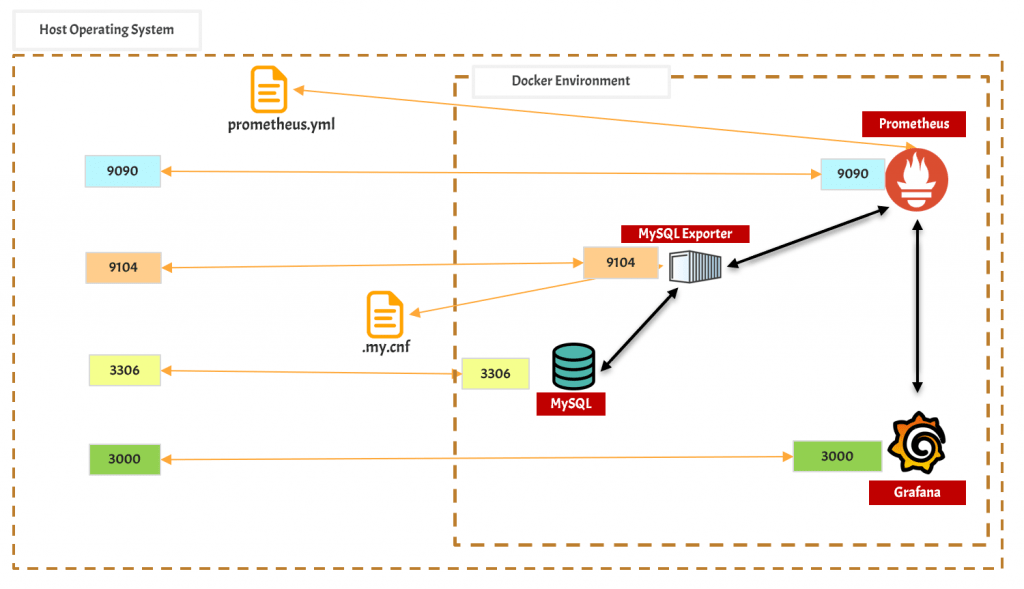
- Check if services are running.
- Define Prometheus Datasource in Grafana
- Create Visualization in Grafana
- References
In today’s world if you are going to build any small application then there is a need to store the application data and for that, you will need a database. MySQL database is the first choice for any developer when they are developing an application for production use cases. In production, your application can behave abnormally, and then you will need to identify the root cause of the abnormality. Sometimes applications can behave abnormally because of the MySQL database and to identify the abnormality you need to collect metrics from the MySQL database server by monitoring the MySQL database.
In this post let’s learn to monitor MySQL using Prometheus and also plot proper graphs for different MySQL metrics.
Prerequisite
we will be using docker and docker-compose to deploy different services. You need to have the below applications on your operating system
- Docker
- For Docker installation: Install Docker on your machine
- Docker Compose
We will be installing below docker services
Create a Docker compose file
You will need a docker-compose file to write the configuration for your services and then deploy the services using the docker-compose file.
Let’s create a new file prometheus-mysql.yml
touch prometheus-mysql.ymlNote: You can create this file in whatever way you want.
Add MySQL Service to the Docker Compose File
MySQL is the RDMS database that is used to store your application data.
Add MySQL service configuration to the docker-compose file
version: '3'
services:

  mysql:
    image: mysql
    container_name: mysql
    restart: always                       # always restart
    environment:
      MYSQL_DATABASE: 'test'              # name of database
      MYSQL_USER: 'sample'                # sample is the name of user
      MYSQL_PASSWORD: 'password'          # password for sample user
      MYSQL_ROOT_PASSWORD: 'password'     # password for root user
    ports:
      - '3306:3306'                       # host port 3306 is mapper to docker port 3306
    expose:
      - '3306'
    volumes:
- ./mysql-db:/var/lib/mysql- The service name will be MySQL
- mysql is the image that is being used for creating docker-container.
- The Port configuration is 3306:3306
- This means that the port exposed inside the container and on the host machine is 3306
- If you want to connect to the MySQL container then you call the host machine on port 3306
- Volume Configuration
- Here we are mounting the ./mysql-db folder on the Host machine to the /var/lib/mysql folder inside the docker container.
- This will help to hold the persistent data on the host machine and there will not be any data loss event if the MySQL container is restarted or re-created.
- Environment Variables
- MYSQL_DATABASE= “test”
- Database created inside MySQL will be the test
- You can create more databases later on
- MYSQL_USER=’sample’
- A user with a name sample will be created
- MYSQL_PASSWORD: ‘password’
- The password for the user sample will be the password
- MYSQL_ROOT_PASSWORD: ‘password’
- The password for the default root user will be the password
- MYSQL_DATABASE= “test”
Add Prometheus Service to Docker Compose File
Prometheus, a Cloud Native Computing Foundation project, is a systems and service monitoring system. It collects metrics from configured targets at given intervals, evaluates rule expressions, displays the results, and can trigger alerts when specified conditions are observed.
Add the below configuration to the file
version: '3'
services:
  prometheus:
    image: prom/prometheus
    volumes:
      - "./prometheus.yml:/etc/prometheus/prometheus.yml"
    ports:
- 9090:9090- The service name will be prometheus
- prom/prometheus is the docker image being used for container creation
- As we are not using any tag so latest image will be pulled up.
- The Port configuration is 9090:9090
- This means that the port exposed inside the container and on the host machine is 9090
- If you want to connect to this container then you call the host machine on port 9090
- Let’s understand the volume part
- Here we are mounting the prometheus.yml file on the Host machine to the /etc/prometheus/prometheus.yml file inside the docker container.
- This will help to write the new configuration which the Prometheus container can understand.
Add Grafana to Docker Compose File
The open-source platform for monitoring and observability. Grafana allows you to query, visualize, alert on and understand your metrics no matter where they are stored. Grafana helps you to plot the metric that is captured inside Prometheus.
Add Grafana configuration the yaml file
version: '3'
services:

  grafana:
    image: grafana/grafana
    container_name: grafana
    ports:
      - 3000:3000
    restart: unless-stopped
    environment:
      - GF_SECURITY_ADMIN_USER=admin
      - GF_SECURITY_ADMIN_PASSWORD=admin
    volumes:
- ./grafana:/etc/grafana/provisioning/datasources- The service name will be grafana
- Docker image grafana/grafana will be used to create the container
- As we are not using any tag so the latest image will be pulled
- The Port configuration is 3000:3000
- This means that the port exposed inside the container and on the host machine is 3000
- If you want to connect to the Granfana container then you call the host machine on port 3000
- Let’s understand the volume part
- Here we are mounting the ./grafana folder on the Host machine to the /etc/grafana/provisioning/datasources folder inside the docker container.
- This will help to hold the persistent data on the host machine and there will not be any data loss event if the Grafana container is restarted or re-created.
- Environment Variable
- GF_SECURITY_ADMIN_USER=admin
- username for the admin user is admin
- GF_SECURITY_ADMIN_PASSWORD=admin
- password for the admin user is the password
- GF_SECURITY_ADMIN_USER=admin
Add MySQL Exporter service to Docker Compose
MySQL exporter is the Prometheus exporter for MySQL server metrics. It connects to the MySQL server and collects metrics from it and sends metrics back to the Prometheus server.
Add MySQL Exporter configuration to the yaml file
version: '3'
services:

  mysql-exporter:
    image: prom/mysqld-exporter
    command:
     - --config.my-cnf=/cfg/.my.cnf
     - --mysqld.address=192.168.18.226:3306
    volumes:
      - "./.my.cnf:/cfg/.my.cnf"
    ports:
- 9104:9104- The name of the service will be mysql-exporter
- The docker image being used is prom/mysqld-exporter
- The Port configuration is 9104:9104
- This means that the port exposed inside the container and on the host machine is 9104
- If you want to connect to the mysql-exporter container then you call the host machine on port 9104
- Let’s understand the volume part
- we are mounting the .my.cnf file on the Host machine to the /cfg/.mycnf file inside the docker container.
- This will help to write the new configuration which the Prometheus container can understand.
- Let’s understand the command part
- –config.my-cnf=/cfg/.my.cnf
- The MySQL-exporter service will run inside the container when it picks up the /cfg/.my.cnf file as the configuration file that we mounted in the volume configuration section.
- –mysqld.address=192.168.18.226:3306
- This will be the address where the MySQL server is running in your case. In this tutorial, we are running on the same machine so we have provided the IP address of the same machine.
- Note: This IP address will be different in your case. It will be the IP address of the machine where your MySQL server is running.
- –config.my-cnf=/cfg/.my.cnf
Create .my.cnf file MySQL Exporter Configuration
.my.cnf file will hold some important configuration that is required by the MySQL Exporter to run and connect to the MySQL instance
Create a file .my.cnf in the same folder where your prometheus-mysql.yml is present
touch .my.cnfAdd the below configuration to it
[client]
user=root
password=password
we are storing the username and password in the .my.cnf file that will help the MySQL Exporter to connect to the MySQL instance.
In this tutorial, we created the MySQL instance where the root user has a password as password.
Note: For your case, the username and password can be different.
Add Prometheus Configuration File
Prometheus needs to know the configuration for scraping. Create prometheus.yml file in the same folder where you have created the prometheus-mysql.yml and then you can add the scraping configuration later on.
touch prometheus.ymlAdd the below configuration to the prometheus.yml file
global:
  scrape_interval: 2s
scrape_configs:
 - job_name: prometheus
   static_configs:
    - targets:
       - prometheus:9090

 - job_name: mysql_exporter
   static_configs:
    - targets:
       - 192.168.18.226:9104
Here we have provided two scraping configs
- Prometheus Scraping Config
- Prometheus is running on port 9090 so we will scrape that
- Also, the hostname is provided as prometheus which is the service name present in the docker-compose file
- MySQL Exporter Config
- MySQL exporter is running on port 9104
- we have provided the IP Address of the host
Final Docker Compose file for MySQL Prometheus
This will be the final docker-compose configuration file.
version: '3'
services:

  mysql:
    image: mysql
    container_name: mysql
    restart: always                       # always restart
    environment:
      MYSQL_DATABASE: 'test'              # name of database
      MYSQL_USER: 'sample'                # sample is the name of user
      MYSQL_PASSWORD: 'password'          # password for sample user
      MYSQL_ROOT_PASSWORD: 'password'     # password for root user
    ports:
      - '3306:3306'                       # host port 3306 is mapper to docker port 3306
    expose:
      - '3306'
    volumes:
      - ./mysql-db:/var/lib/mysql

  prometheus:
    image: prom/prometheus
    volumes:
      - "./prometheus.yml:/etc/prometheus/prometheus.yml"
    ports:
      - 9090:9090

  grafana:
    image: grafana/grafana
    container_name: grafana
    ports:
      - 3000:3000
    restart: unless-stopped
    environment:
      - GF_SECURITY_ADMIN_USER=admin
      - GF_SECURITY_ADMIN_PASSWORD=admin
    volumes:
      - ./grafana:/etc/grafana/provisioning/datasources

  mysql-exporter:
    image: prom/mysqld-exporter
    command:
     - --config.my-cnf=/cfg/.my.cnf
     - --mysqld.address=192.168.18.226:3306
    volumes:
      - "./.my.cnf:/cfg/.my.cnf"
    ports:
      - 9104:9104
Check if services are running.
Prometheus
Open the below address in the browser
http://localhost:9090/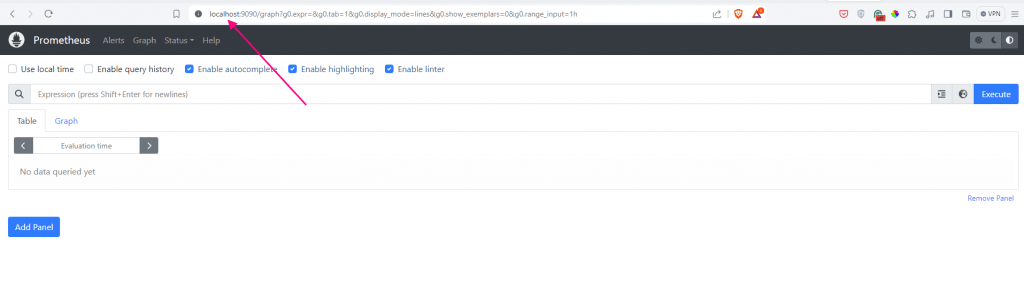
Grafana
Open the below address in the browser
http://localhost:3000/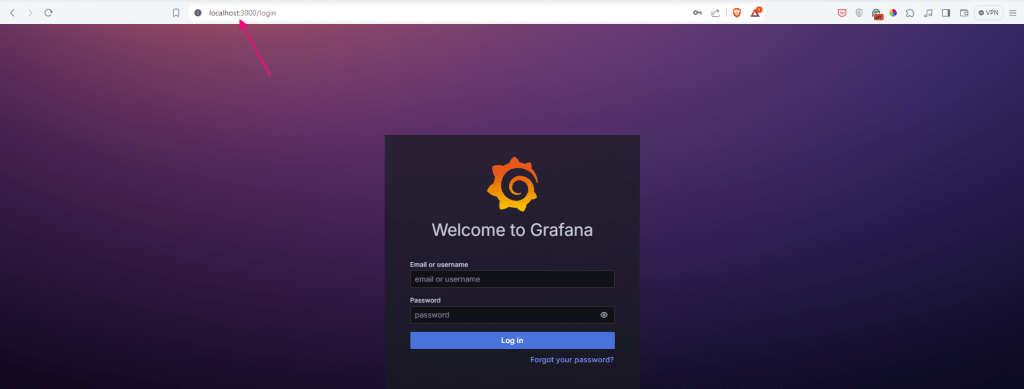
Login credentials are
- username = admin
- password = admin
Once you do the login then it will ask you to change the password. You can set a new password and log in to the Grafana portal.
MySQL
You need to check if you can log in to the MySQL server or not. You need to have MySQL client installed on your machine to do the login.
Use the below command to log in to MySQL. This will ask you for the password.
mysql -h 127.0.0.1 -uroot -p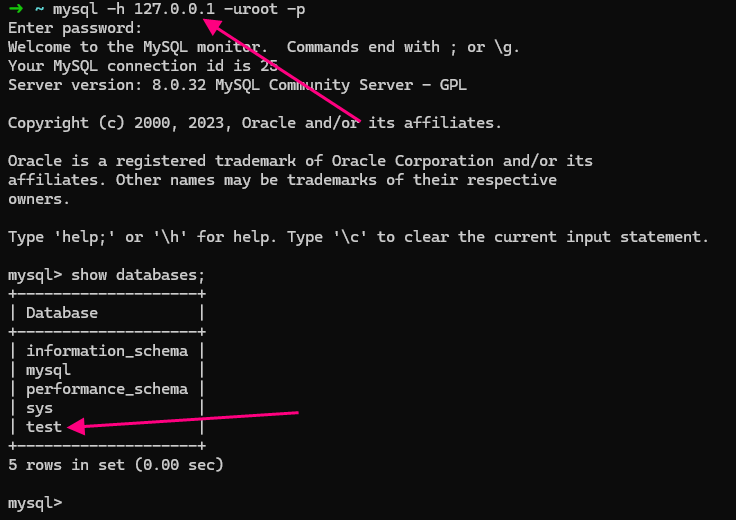
In the database list you can see that test database is also created which was provided in the docker-compose file.
MySQL Exporter
Open the below address in the browser to check if MySQL Exporter is running or not.
http://localhost:9104/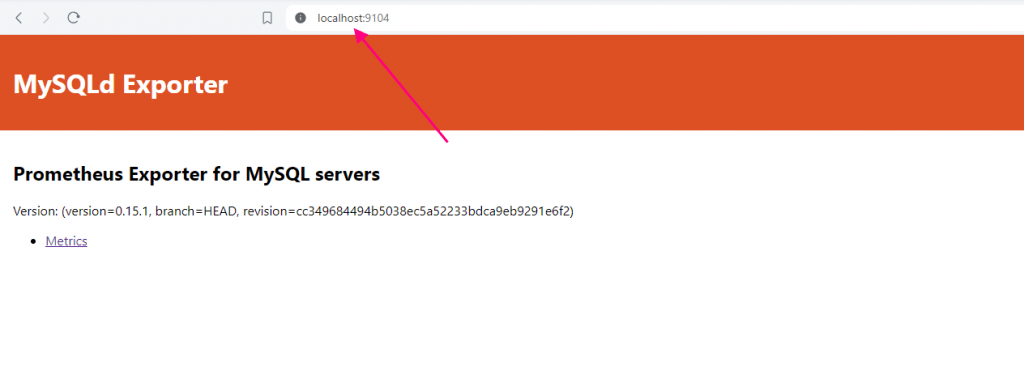
Also if you click on the Metrics link then you will see that MySQL-related metrics will be visible on the browser screen.
Note: If MySQL-related metrics are not visible then it means that MySQL Exporter is not able to scrape the data from MySQL server.
Define Prometheus Datasource in Grafana
Before plotting the visualization you need to define the Prometheus datasource in Grafana.
Login to the Grafna portal and then click on Connections ==> Data Sources ==> Add Data Source
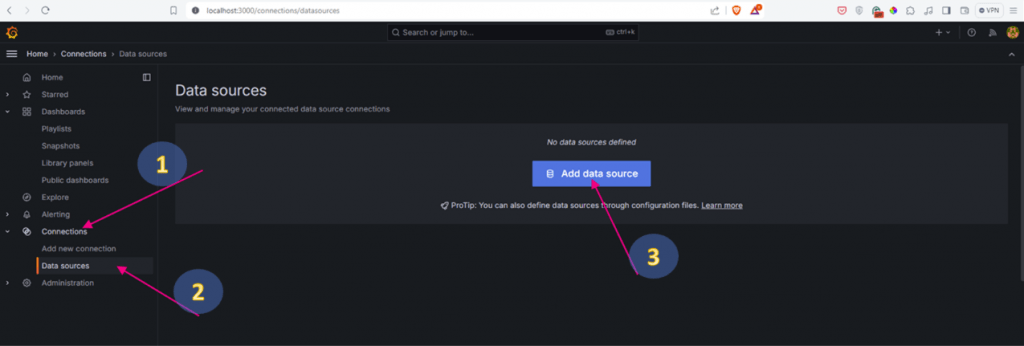
Once you Click on Add data sources then select Prometheus as the data source
In the next configuration enter the Prometheus Server URL as
http://prometheus:9090- The hostname is the docker service name which is prometheus
- Prometheus is running on port 9090 as configured in the docker-compose file.
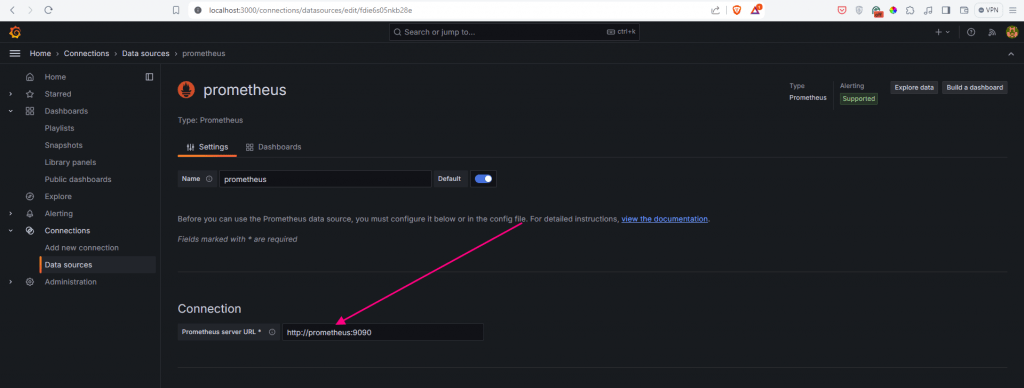
At the bottom of the screen click on Save & Test. If everything working fine then you will be getting a success message in green color.
Create Visualization in Grafana
Go to the Explore section and start writing your promQL query
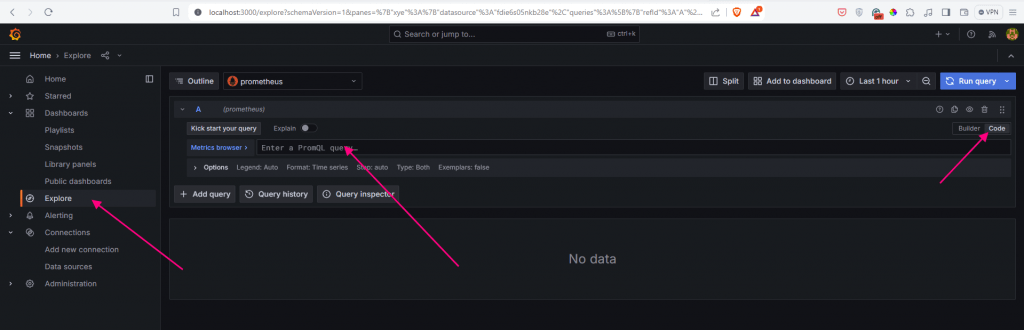
You can start writing queries and creating the visualizations.