- Create a Docker Compose file
- Add Prometheus Service to Docker Compose File
- Add Grafana to Docker Compose File
- Final Docker Compose File
- Start the Services
- Check Prometheus service is running
- Check Grafana is Running
- References
In this post, we will learn to install Prometheus and Grafana using Docker Compose. Installation using Docker Compose will be Operating system agnostic. Prometheus and Grafana are monitoring tools for your application.
Using Prometheus you can collect metrics from different sources like NodeJs, Python, etc application, and then use Grafana to plot meaningful graphs using the collected data.
Create a Docker Compose file
You will need a docker-compose file to write the configuration for your services and then deploy the services using the docker-compose file.
Let’s create a new file prometheus-grafana.yml
touch prometheus-grafana.ymlNote: You can create this file in whatever way you want.
Add Prometheus Service to Docker Compose File
Prometheus, a Cloud Native Computing Foundation project, is a systems and service monitoring system. It collects metrics from configured targets at given intervals, evaluates rule expressions, displays the results, and can trigger alerts when specified conditions are observed.
Add the below configuration to the file
version: '3'
services:
  prometheus:
    image: prom/prometheus
    volumes:
      - "./prometheus.yml:/etc/prometheus/prometheus.yml"
    ports:
- 9090:9090- The service name will be prometheus
- prom/prometheus is the docker image being used for container creation
- As we are not using any tag so latest image will be pulled up.
- The Port configuration is 9090:9090
- This means that the port exposed inside the container and on the host machine is 9090
- If you want to connect to this container then you call the host machine on port 9090
- Let’s understand the volume part
- Here we are mounting the prometheus.yml file on the Host machine to the /etc/prometheus/prometheus.yml file inside the docker container.
- This will help to write the new configuration which the Prometheus container can understand.
Add Prometheus Configuration File
Prometheus needs to know the configuration for scraping. Create prometheus.yml file in the same folder where you have created the prometheus-grafana.yml and then you can add the scraping configuration later on.
touch prometheus.ymlAdd Grafana to Docker Compose File
The open-source platform for monitoring and observability. Grafana allows you to query, visualize, alert on and understand your metrics no matter where they are stored. Grafana helps you to plot the metric that is captured inside Prometheus.
Add Grafana configuration the yaml file
version: '3'
services:

  grafana:
    image: grafana/grafana
    container_name: grafana
    ports:
      - 3000:3000
    restart: unless-stopped
    environment:
      - GF_SECURITY_ADMIN_USER=admin
      - GF_SECURITY_ADMIN_PASSWORD=admin
    volumes:
- ./grafana:/etc/grafana/provisioning/datasources- The service name will be grafana
- Docker image grafana/grafana will be used to create the container
- As we are not using any tag so the latest image will be pulled
- The Port configuration is 3000:3000
- This means that the port exposed inside the container and on the host machine is 3000
- If you want to connect to the Granfana container then you call the host machine on port 3000
- Let’s understand the volume part
- Here we are mounting the ./grafana folder on the Host machine to the /etc/grafana/provisioning/datasources folder inside the docker container.
- This will help to hold the persistent data on the host machine and there will not be any data loss event if the Grafana container is restarted or re-created.
- Environment Variable
- GF_SECURITY_ADMIN_USER=admin
- username for the admin user is admin
- GF_SECURITY_ADMIN_PASSWORD=admin
- password for the admin user is the password
- GF_SECURITY_ADMIN_USER=admin
Final Docker Compose File
The final docker-compose file will be
version: '3'
services:
  prometheus:
    image: prom/prometheus
    volumes:
      - "./prometheus.yml:/etc/prometheus/prometheus.yml"
    ports:
      - 9090:9090

  grafana:
    image: grafana/grafana
    container_name: grafana
    ports:
      - 3000:3000
    restart: unless-stopped
    environment:
      - GF_SECURITY_ADMIN_USER=admin
      - GF_SECURITY_ADMIN_PASSWORD=admin
    volumes:
      - ./grafana:/etc/grafana/provisioning/datasources
Start the Services
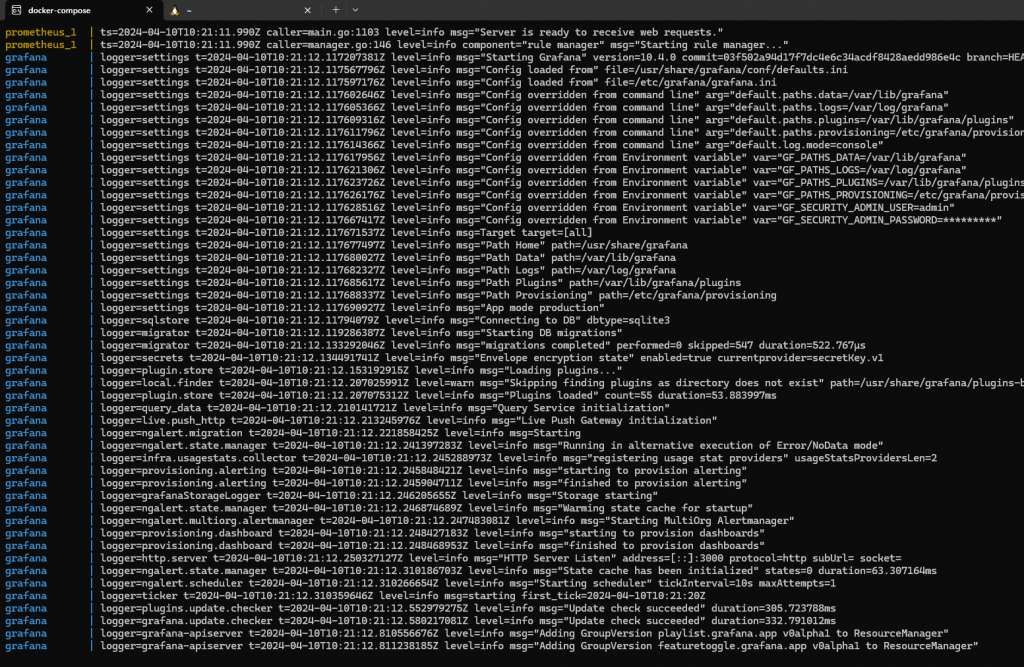
Run the below command to start the Prometheus and Grafana services in foreground mode.
This will create two docker containers
docker-compose -f prometheus-grafana.yml up 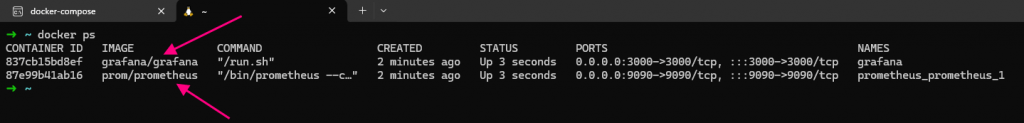
Check Prometheus service is running
Go to your web browser and open the below URL and this will open the Prometheus interface.
http://localhost:9090/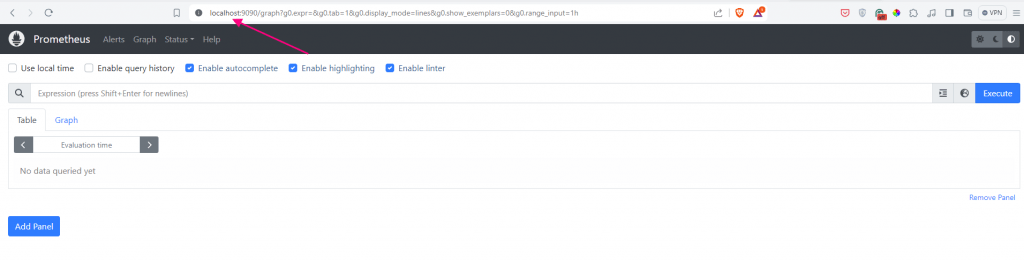
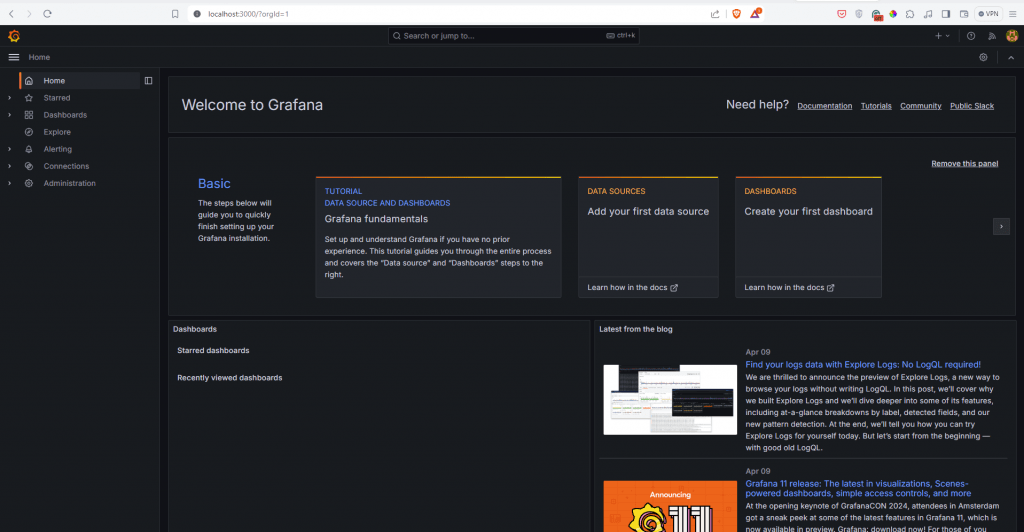
Check Grafana is Running
Go to your web browser and open the below URL and this will open the Grafana interface.
http://localhost:3000/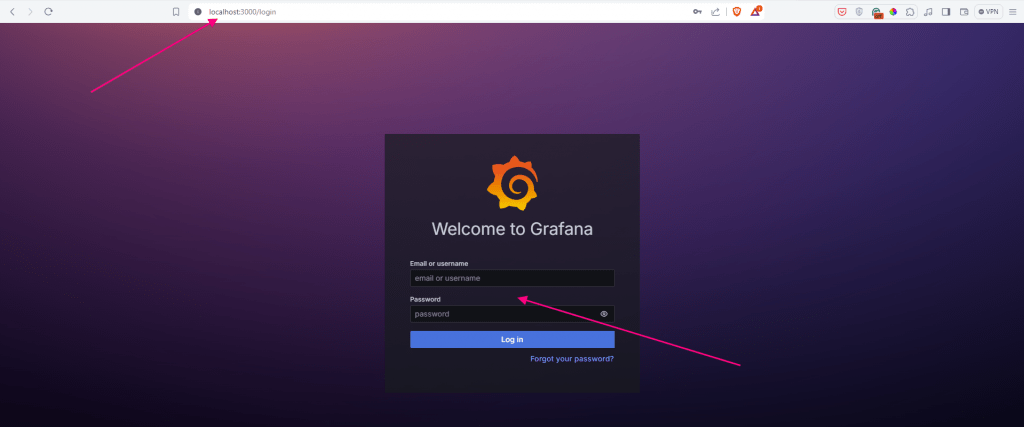
Enter the below credentials and this will help you to Login and will ask for setting up a new password.
- username = admin
- password = admin
References
- You can view the list of other docker-compose-related service installations in my GitHub Repository
- MySQL Docker Compose