Sometimes we need to analyze our logs and perform some analysis on them. We can’t perform analysis by reading the log file directly because it will be very time-consuming and the data is unstructured. We need to consume the logs from different services and dump them to the Elasticsearch database with some enrichment using Logstash. Let’s learn to read log files using Logstash and then put the data to the Elasticsearch server and finally view the data in the Kibana
Prerequisite
- Logstash must be installed
- Fake Apache Log Generator
- Elasticsearch and Kibana
Generate the log data
- Follow the prerequisite step for the Fake Apache Log Generator
- we will be generating a continuous amount of logs at an interval of 2 second
python apache-fake-log-gen.py -n 0 -s 1 -o LOGThis will create a log file with a prefix as access_log. Few of the sample contents in the file will be
56.228.203.49 - - [01/Sep/2020:00:23:32 +0530] "PUT /wp-admin HTTP/1.0" 200 4988 "http://www.mccoy.com/about.htm" "Mozilla/5.0 (Macintosh; PPC Mac OS X 10_7_1 rv:4.0; en-US) AppleWebKit/533.2.1 (KHTML, like Gecko) Version/4.0.4 Safari/533.2.1"
49.40.236.125 - - [01/Sep/2020:00:23:34 +0530] "GET /explore HTTP/1.0" 200 4977 "http://www.shelton-young.org/" "Mozilla/5.0 (Windows; U; Windows 98) AppleWebKit/535.21.4 (KHTML, like Gecko) Version/4.0.5 Safari/535.21.4"
251.137.140.55 - - [01/Sep/2020:00:23:36 +0530] "POST /apps/cart.jsp?appID=4049 HTTP/1.0" 500 4966 "http://jones.com/search/tags/tags/search/" "Mozilla/5.0 (Macintosh; U; Intel Mac OS X 10_7_8) AppleWebKit/5330 (KHTML, like Gecko) Chrome/15.0.888.0 Safari/5330"
Configure the Logstash for Data Consumption
we are using the Linux operating system so all pipeline configurations related to Logstash should be present in the below folder
/etc/logstash/conf.d/- The above folder holds all the pipeline configurations. From now on we will call this config folder LOGSTASH_CONFIG_FOLDER
- create a file with name pipeline.conf inside LOGSTASH_CONFIG_FOLDER
- You can view the logs of the Logstash using the below command. This will open the logs in tail mode.
journalctl -u logstash -fLogstash input configuration for reading log file
The first thing while creating theLogstash pipeline is to define the input configuration. As we are reading data from a file, so we will be using the File input plugin
input {
  file {
    id => "apache-log-reader"
    path => ["/home/selftuts/sandbox/apache-logs/*.log"]
    start_position => "beginning"
    mode => "tail"
  }
}
The different configurations for file input plugins are
- id: This is a unique ID to the plugin configuration. This helps while debugging the pipeline in case of failures.
- path: An array of file paths. These files provided here will be considered for reading. In our case, we will be reading all log files having the prefix access_log and present inside /home/selftuts/apache-logs/ folder.
- start_position: When a new file is encountered then it will read from the beginning of the file.
- mode: This is never-ending stream and will read the new logs as soon as they are written the log files.
Logstash output configuration for publishing log data to the Elasticsearch
output {
  elasticsearch {
        hosts => ["192.168.0.10:9200"]
        index => "app-log"
  }
}- we provide the IP address of the Elasticsearch inside the host field.
- The default port for the Elasticsearch is 9200
- Then log data will be published inside the app-log index.
The final Logstash configuration file will look like
input {
  file {
    id => "apache-log-reader"
    path => ["/home/selftuts/sandbox/apache-logs/*.log"]
    start_position => "beginning"
    mode => "tail"
  }
}

output {
  elasticsearch {
        hosts => ["192.168.0.10:9200"]
        index => "app-log"
  }
}
Start Logstash service and view logs
You need to start/restart the Logstash server
sudo systemctl restart logstashYou can view Logstash logs using journalctl
journalctl -u logstash -fIf there is no error in the logs then, the Logstash pipeline was loaded successfully, and it will start to consume data from the log file and publish that to the Elasticsearch.
Access data in Kibana
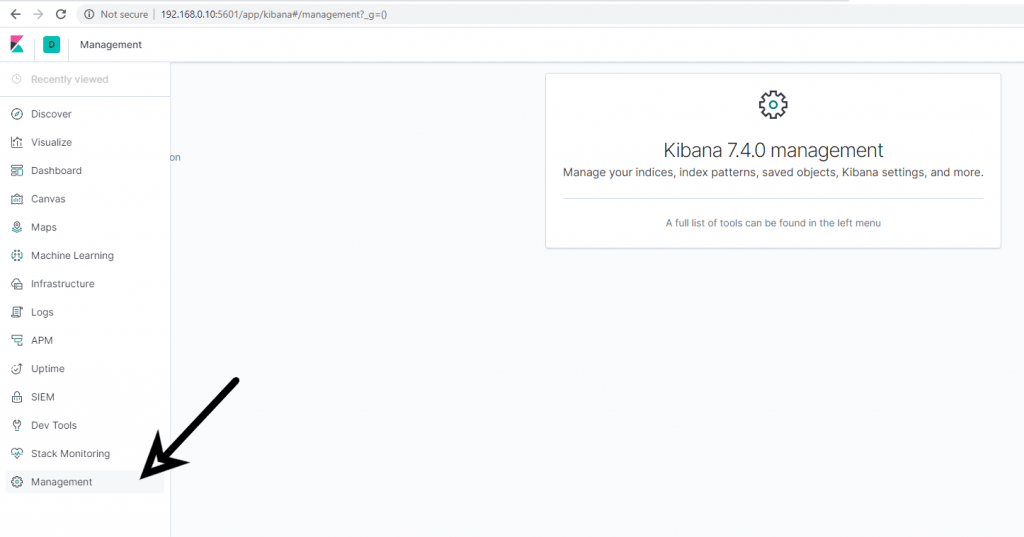
Kibana was installed in the Prerequisite step. Open Kibana running at http://localhost:5601 Goto Management Menu
Click on Index Patterns and then click on Create Index Pattern
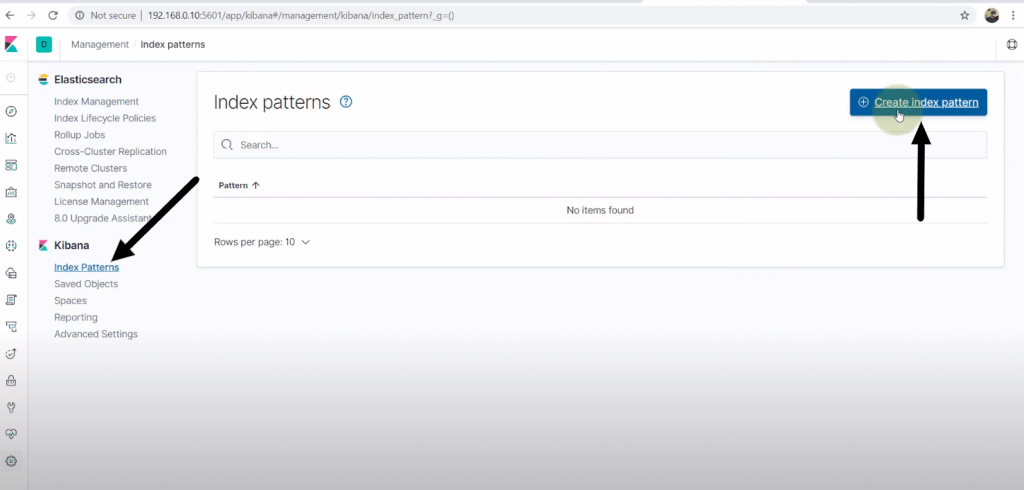
- Search for your index (app data) then click the next step
- Then click on Show Advanced Options and select @timestamp from the dropdown box
- Finally, click on Create index pattern and your index will be created
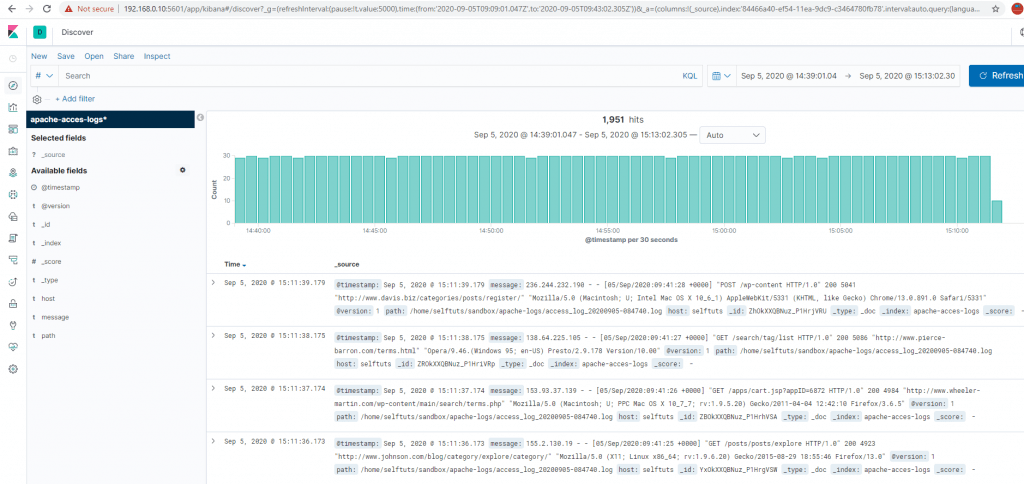
Viewing Data in Kibana
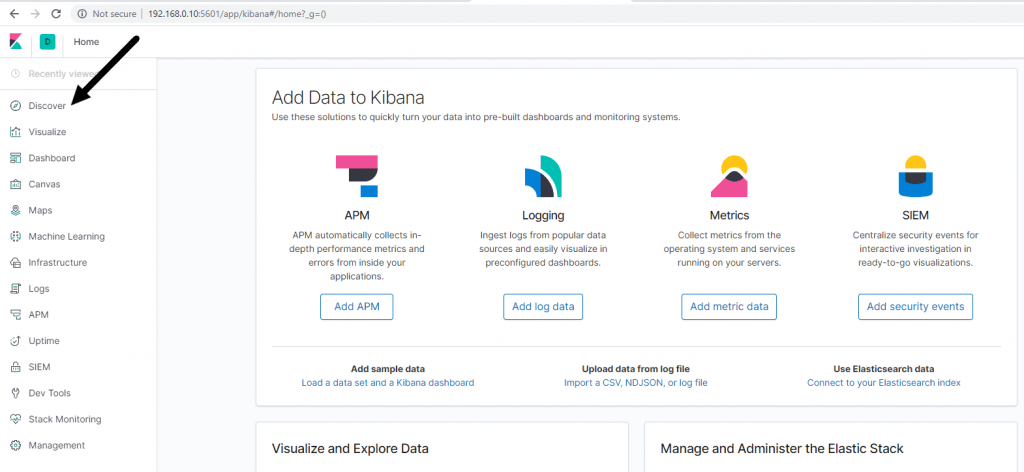
Once the index has been created then you can go to the Discover menu of Kibana
You will see the index app-data is already selected and the data is present.