- Logging in Monolithic Application
- Logging in Microservice Architecture
- Elasticsearch
- Logstash
- Kibana
- References
Let’s understand the ELK stack and why it has become important for any developer, tester, or dev-ops person to understand the working and usage of the ELK stack. we will understand why there is demand for ELK stack these days. ELK stands for
- E = Elasticsearch
- L = Logstash
- K = Kibana
we will understand the ELK stack from the application logging example.
Logging in Monolithic Application
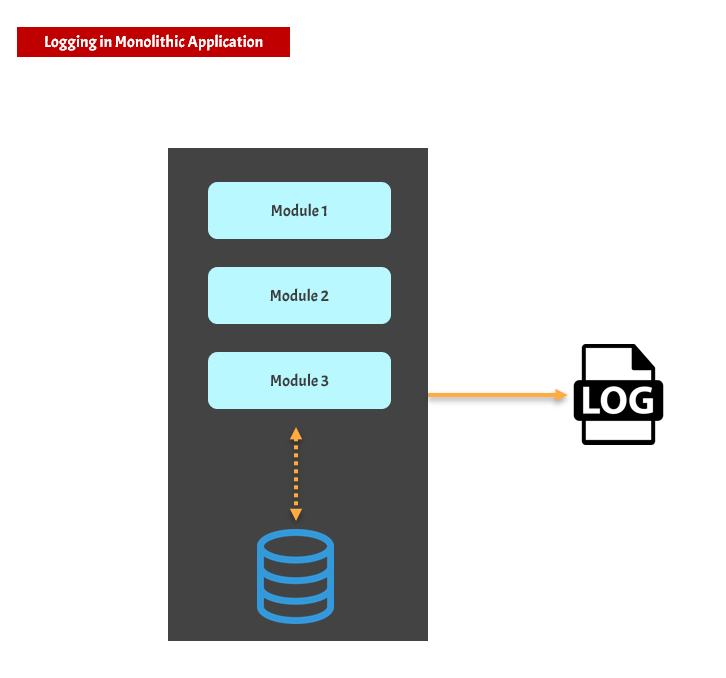
A monolithic application has the following features
- It’s a large codebase written as a single application.
- This large application writes logs into a single file.
If you want to view logs of a monolithic application then it is easy because you have a single log file.
- You can go to the machine where the log file is present.
- Just open or tail the log file and you can view the logs
Logging in Microservice Architecture
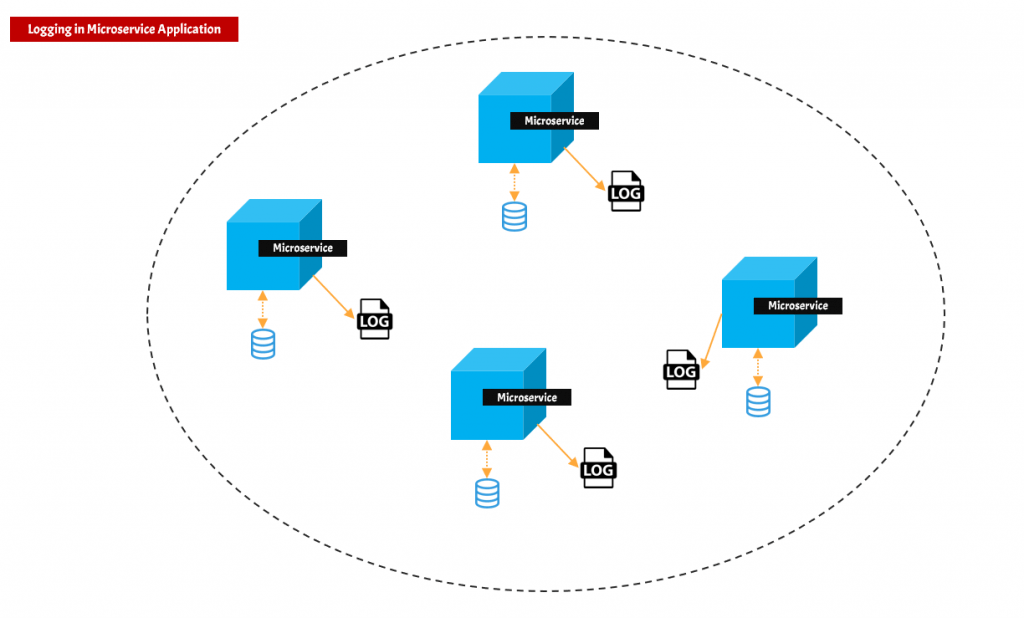
The current software industry is heavily influenced by microservice architecture, and most companies follow the microservice architecture for their application development. The microservice architecture has the following features
- There are a large number of smaller applications.
- All these smaller applications/services come together to achieve a bigger goal.
- Microservice can be scattered across the network which means that the services can be deployed on different machines.
- Each microservice has its log. Thus, the logs are present in different machine
This creates a serious issue. Now if you want to view the logs, you have to visit each machine and view logs inside each microservice. Sometimes this is frustrating and time-consuming. we need a centralized place where logs can be aggregated. Here comes the power of the ELK stack which can help you do centralized logging
Elasticsearch
This is the most important part or heart of the ELK stack. Elasticsearch is a database where you can store a large amount of data. You can write search queries over this data using REST API. Considering our microservice logging example
- Elasticsearch will store the logs of different microservice
- This acts as a centralized place where logs are stored
Logstash
Logstash plays an important role in data movement. It has three main responsibilities.
- Ingestion: Logstash reads data from multiple sources. It can be a file, messaging queue, database, etc.
- Transformation: Logstash can also help in the transformation or enrichment of data. You can take unstructured data and convert that to a meaningful structure for better reading. Logstash has many built-in plugins that help in data transformations. The most important plugin is Grok.
- Sink: Once data is transformed then it should be dumped or sent to some place. In the ELK ecosystem, the Logstash pushes data to the Elasticsearch
Considering the microservice logging example. Logstash will read data from all the logs files of the microservice and then dump/push that log data to the Elasticsearch
Kibana
Kibana lets you visualize the data that is stored in Elasticsearch. It acts as a graphical user interface for the Elasticsearch data
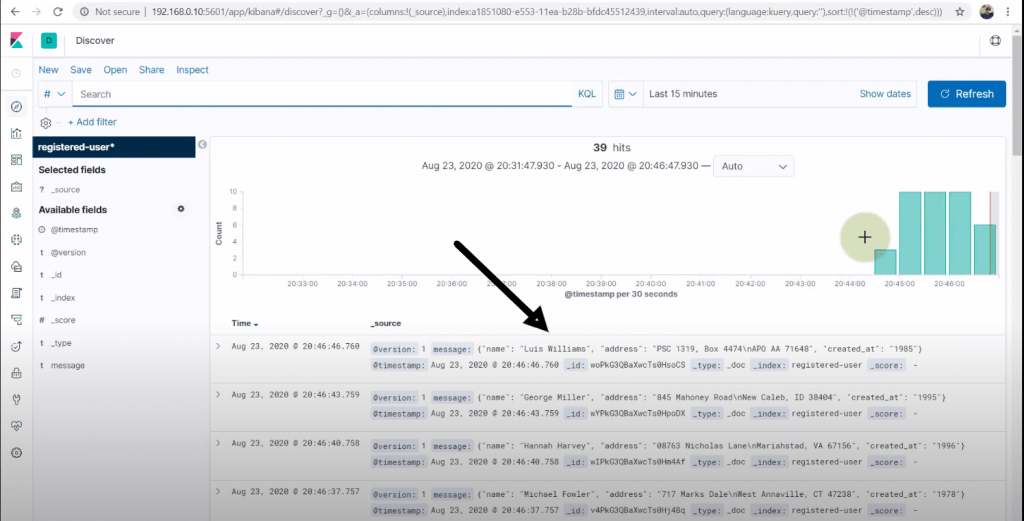
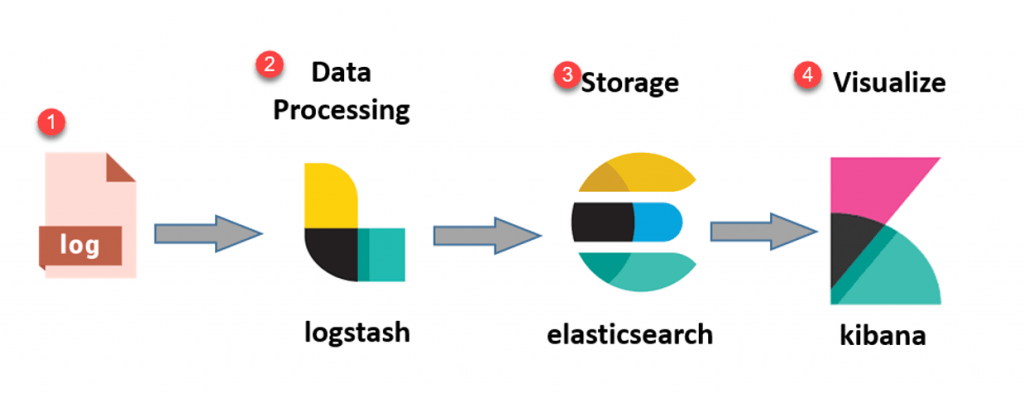
Considering the microservice logging example, Kibana will help you see the logs of all the microservices. You can query the data using Kibana and get meaningful results. Finally, you can say that ELK can be represented as